

Backtesting Guide
Backtesting is a controlled experiment on historical data, not an equity-curve contest. Learn how to freeze rules, prevent look-ahead, model costs and fills, separate unseen data and stress-test whether an apparent edge is robust.
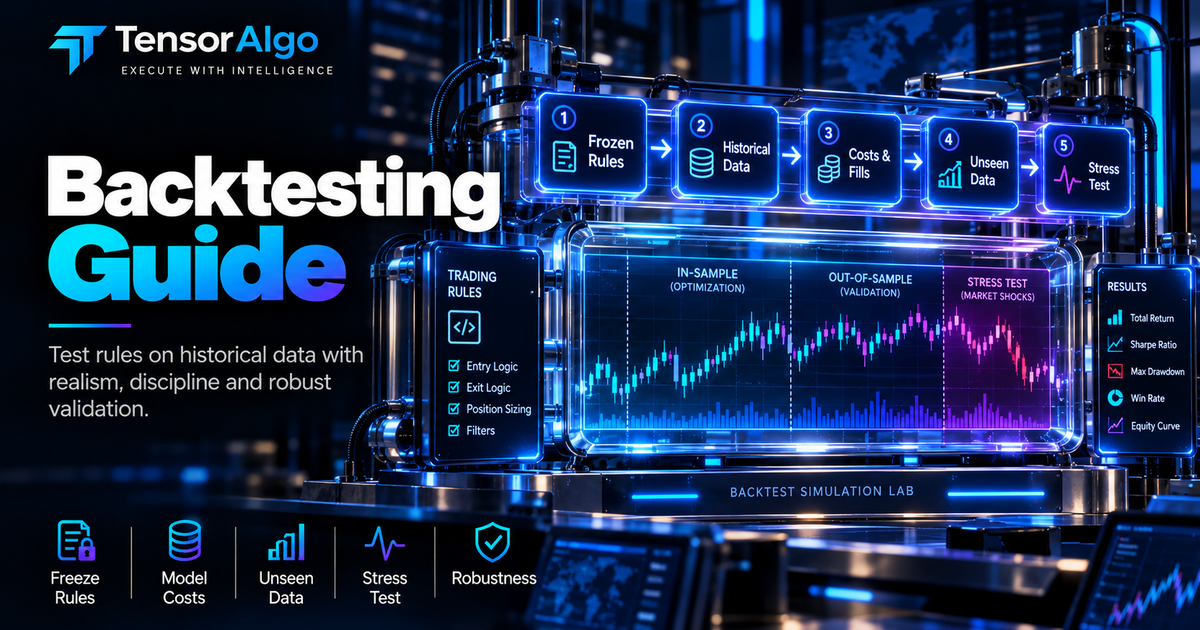
Backtesting Guide: How to Test Trading Strategies Without Fooling Yourself
Backtesting asks how a fully specified strategy would have behaved on historical data. Its value comes from disciplined falsification—not from producing the smoothest equity curve.
Educational information only. Backtests are hypothetical and do not guarantee future results.
Freeze the strategy definition
Before running the test, define:
- market and contract construction;
- session/time zone;
- setup and trigger;
- entry order assumptions;
- invalidation/stop;
- target/management;
- sizing;
- costs;
- event restrictions.
If rules are changed after seeing results, you are doing research, not validating the original strategy.
Use point-in-time information
Every decision must use only information available at that timestamp. Common look-ahead errors include future bars, finalized session values, revised datasets, or indicators calculated with future information.
For multi-timeframe data, ensure higher-timeframe bars are not treated as complete before they actually close.
Futures data requires special care
Contract expirations and rolls can create artificial jumps. Decide whether the strategy trades individual contracts or a continuous series, document the roll method, and ensure execution prices are realistic for the actual contract.
Liquidity can migrate before expiration.
Model orders realistically
A touched price does not always equal a fill. Define how market, limit, stop, and stop-limit orders behave.
For bar-based tests, if both stop and target fall inside the same bar, the sequence may be unknowable. Use conservative assumptions or higher-resolution data rather than choosing the favorable outcome.
Include costs and slippage
Add commissions, exchange/broker fees where relevant, spread effects, and realistic slippage. Stress-test worse execution.
If the strategy disappears under a small deterioration in costs, that fragility is important evidence.
In-sample versus out-of-sample
Use an earlier development period to form/tune the strategy and preserve later data for validation. Do not repeatedly inspect the test set while tuning.
Once the holdout influences development, it is no longer truly unseen.
Walk-forward testing
Walk-forward testing repeatedly:
- develops/calibrates on an earlier window;
- evaluates on the following unseen window;
- advances through time.
It can reveal whether a strategy remains useful across changing conditions rather than only one historical period.
Parameter sensitivity
Test a neighborhood around chosen values. A robust idea should not normally depend on one magical threshold.
Plot or tabulate results across sensible stop, target, lookback, and filter ranges while controlling the number of experiments.
Multiple-testing bias
If you try thousands of variants, some will look excellent by chance. Keep an experiment log and account for how many hypotheses were tested.
A “best” backtest selected from a huge search requires stronger skepticism than a pre-specified test.
Segment results
Break results down by:
- year/quarter;
- session;
- long/short;
- volatility regime;
- trend/balance state;
- instrument;
- setup version.
This reveals whether aggregate performance depends on one unusual period.
Metrics beyond net profit
Review trade count, expectancy, payoff distribution, profit factor, drawdown, losing streaks, MFE/MAE, exposure, costs, and concentration of returns.
Report uncertainty rather than treating historical averages as fixed future parameters.
Monte Carlo and resampling
Resampling trade sequences can illustrate how ordering affects drawdown and losing streaks. It does not create new market regimes or repair a biased backtest, but it can improve understanding of path risk.
Backtest → forward test
Historical validation should lead to a forward stage using live-arriving data. Compare expected versus observed signal frequency, fills, costs, and regime behavior.
Do not automatically deploy a strategy because historical metrics cross a threshold.
Build a Research Specification
Before touching results, write the hypothesis, instruments, data period, time zone, contract-roll treatment, setup, execution model, risk, metrics and acceptance criteria. This document limits hindsight and makes later changes visible.
Data Quality Checklist
Check missing bars/ticks, duplicates, timestamp convention, corporate or contract adjustments where relevant, futures rolls, session boundaries and whether historical fields were actually available in real time. Bad data can create a convincing but nonexistent edge.
Bar Ambiguity
If a bar's high touches the target and its low touches the stop, OHLC alone may not reveal which occurred first. Resolve with higher-resolution data or a conservative rule. Choosing the favorable sequence is hidden look-ahead.
Futures Roll Methodology
Continuous futures series are useful for research but can introduce artificial price jumps or adjustments. Document whether signals use adjusted series while fills use individual contracts, and when liquidity is considered to have rolled.
Costs and Fill Models
Model commissions, fees, spread and slippage. For limit orders, “price touched” does not prove queue execution. Stress-test worse fills and missed fills, especially for strategies whose average edge per trade is small.
Out-of-Sample Design
Separate development and evaluation. A holdout loses its status when you repeatedly inspect it and tune the strategy. Walk-forward testing can provide multiple chronological unseen windows, but each tuning decision still consumes information.
Multiple Testing
Trying hundreds of indicators, thresholds and exits increases the probability that something looks exceptional by chance. Record every experiment, not only winners. Bailey et al.'s Probability of Backtest Overfitting provides a deeper treatment of this selection problem.
Sensitivity Analysis
Move parameters around the chosen value, perturb costs, shift entry timing and test neighboring periods. Stable plateaus are generally more credible than isolated peaks. Sensitivity does not prove future success; it tests fragility.
Monte Carlo
Resampling trades or modeled returns can explore sequence risk and drawdown paths. It cannot create missing regimes or fix biased input data. Treat it as a path-risk tool after the underlying backtest is credible.
Backtest Report Template
Report strategy/version, period, instruments, trades, gross/net expectancy, costs, win/loss distribution, drawdown, MFE/MAE, regime/session splits, parameter sensitivity and out-of-sample results. Then hand the frozen candidate to Forward Testing.
Primary References
The CFTC provides primary futures-risk education. For time-series model validation, scikit-learn's TimeSeriesSplit documentation illustrates chronological splitting mechanics.
TensorAlgo After the Backtest
A backtest is research evidence, not a production decision. TensorAlgo can help carry a validated idea forward as a defined Playbook and preserve market-context and review evidence, while the strategy version, assumptions and forward-test criteria remain explicit. Current product scope is documented in the Support Center.
Event-Based Backtests
Some strategies are better represented as events than fixed bars. Define the event timestamp and prevent overlapping labels from creating duplicated exposure. Event sampling can reduce irrelevant observations but introduces its own selection rules.
Intrabar Resolution
A one-minute strategy tested on five-minute OHLC cannot reliably reconstruct order sequence inside each bar. Use data resolution appropriate to the execution rule and document any assumptions when exact sequencing remains unknown.
Limit Order Modeling
A market trading at your limit price does not prove your order filled. Conservative models may require trade-through, queue assumptions or probabilistic fills. Compare results under several plausible models.
Survivorship and Universe Bias
For strategies across changing instrument universes, using only products that survive to the end can bias results. Futures-specific research also needs to account for contract availability and historical liquidity.
Optimization Budget
Predefine how many parameters and variants you are willing to test. The more searches performed, the stronger the evidence required from unseen data. Keep the full experiment history.
Walk-Forward Windows
Window length encodes an assumption about how quickly the strategy changes. Test whether conclusions depend heavily on one arbitrary training length. Very short windows can chase noise; very long windows can dilute regime change.
Benchmark Strategy
Compare the candidate with a simpler rule or prior production version under identical costs and dates. Improvement should be incremental and attributable rather than a comparison against zero.
Risk Simulation
Apply the position-sizing and daily-risk rules that would exist in production. A signal-level backtest without account constraints can understate path dependence and overstate deployable size.
Reproducibility Package
Save code/version, data identifiers, configuration, random seeds where relevant and the generated report. Someone should be able to rerun the test and obtain materially the same result.
Red Flags
Be skeptical of extremely smooth curves, tiny drawdowns, near-perfect win rates, huge parameter sensitivity or results concentrated before the strategy was conceived. Investigate data and assumptions before celebrating.
A Backtest Is an Experiment, Not a Search for the Best Curve
The strongest backtests begin with a written hypothesis and a frozen specification. Record the market, session, setup definition, entry/exit logic, costs, sizing, data source and evaluation metrics before inspecting the final result. Every extra parameter tried after seeing outcomes increases the opportunity to fit noise.
Bailey, Borwein, López de Prado and Zhu formalize this concern in their work on the Probability of Backtest Overfitting: selecting among many tested configurations can produce apparently strong historical results that degrade out of sample. The practical lesson is not that backtesting is useless; it is that the research process itself must be part of the evidence.
Cost and Fill Sensitivity
Test more than one execution assumption. A strategy that only works with zero slippage and optimistic fills has a different evidence profile from one that remains viable under moderately worse assumptions. For intraday futures, evaluate commissions/fees, spread, stop slippage and whether a limit order would realistically have been filled.
Bar data can hide sequence. If the same bar touches both a target and a stop, OHLC alone may not tell you which occurred first. Use higher-resolution data or conservative rules rather than silently choosing the favorable path.
The Futures Trading Glossary defines tick value, slippage, MFE/MAE and related execution terms; the Position Sizing Guide shows why tick economics must flow into risk calculations.
Validation Stages
A practical evidence funnel is:
- Development sample: build and debug the idea.
- Validation sample: compare reasonable variants without touching the final holdout.
- Unseen/holdout sample: use sparingly for a cleaner estimate of generalization.
- Walk-forward or rolling evaluation: repeat selection/evaluation through time.
- Forward test: freeze the candidate and observe live-arriving data.
For machine-learning strategies, temporal splits are essential because random cross-validation can mix future and past observations. Scikit-learn's time-series examples explicitly use time-sensitive splits and can include a gap between training and test windows. The Machine Learning in Financial Markets guide expands on leakage and temporal validation.
Stress the Idea, Not Just the Parameters
Vary plausible costs, entry delay, stop/target assumptions, nearby parameter values, start/end dates and regime composition. A robust idea should not depend on one magical setting or a tiny cluster of trades. Inspect concentration: if most expectancy comes from one day, one market regime or a few outliers, report that explicitly.
Then move the frozen candidate into the Forward Testing Guide. Forward testing is not a victory lap; it is the next experiment, where data, implementation and operational assumptions meet current conditions.
Primary-Source Context
Use current exchange documentation for contract specifications and trading mechanics. CME Education is a useful starting point for CME-listed futures, while CFTC Learn & Protect provides derivatives risk education. Historical simulation cannot remove the leverage and execution risks of live futures.
Report the Search Budget
A backtest report should state how many markets, sessions, indicators, parameter combinations and rule variants were explored before the final candidate was chosen. Ten attractive statistics mean something different after ten tests than after ten thousand. The search budget is part of the evidence.
Use a simple benchmark
Compare the strategy with a simpler baseline or reduced rule set. If a complicated filter adds no stable improvement over the baseline, the extra complexity creates more ways to fail without adding demonstrated value.
Inspect the trade distribution
Do not summarize everything into one Sharpe ratio, win rate or profit factor. Examine average and median outcomes, tails, longest losing sequences, drawdown duration, exposure, trade frequency and contribution by period/regime. A handful of extreme winners can dominate an average.
Reproducibility checklist
Preserve the exact data version, contract-roll method, session template, code/configuration, strategy version, fees, slippage assumptions and random seeds where applicable. A result that cannot be reproduced cannot be audited effectively.
Know what the backtest cannot show
Historical data cannot fully reproduce queue priority, future liquidity, psychological behavior, outages or every broker/exchange edge case. State those limitations in the report instead of hiding them inside a single performance number.
A strong backtest therefore produces more than a chart. It produces a documented experiment, sensitivity analysis, list of known limitations and a frozen candidate ready for genuinely new evidence. That package makes the transition to forward testing much more informative and makes later failures easier to diagnose.
Sensitivity Before Optimization
Instead of asking for the single parameter value with the highest historical return, inspect a neighborhood of plausible values. Broad regions of similar behavior are generally more informative than an isolated peak. If a one-tick or one-period change destroys the result, investigate why before trusting the optimum.
Run cost sensitivity the same way. Report results at the base assumption and under moderately worse fills and fees. This makes the economic margin of safety visible.
Finally, keep a research log of rejected ideas. Knowing what failed prevents the same hypothesis from being rediscovered and retested later without accounting for the earlier search. The history of experiments is part of the evidence, especially when many variations have been explored.
Preserve the Null Result
A well-designed backtest that finds no robust edge is still useful. It prevents weak ideas from consuming forward-testing time and adds to the research history. Record why the candidate was rejected and which assumptions failed so the same idea is not repeatedly rediscovered under a different name.
Frequently Asked Questions
What makes a backtest credible?
A credible backtest uses frozen rules, point-in-time data, realistic costs and fills, an explicit search process and evaluation on data that was not used to tune the strategy.
How do you prevent look-ahead bias?
Ensure every feature, level, bar value and label uses only information that would have been available at the simulated decision timestamp.
How should slippage and fees be modeled?
Use realistic assumptions for the instrument, order type, size and trading session, then stress those assumptions to see whether the apparent edge survives worse execution.
When should a strategy move from backtesting to forward testing?
After the rules are frozen, implementation matches the research logic, out-of-sample evidence is acceptable and promotion criteria have been defined in advance.
Final Takeaway
A backtest should try to disprove an idea, not decorate it. Freeze the rules, preserve point-in-time information, model realistic execution, report the search process and require unseen plus forward evidence before treating the result as durable.